27 Quintillion Transit Charts

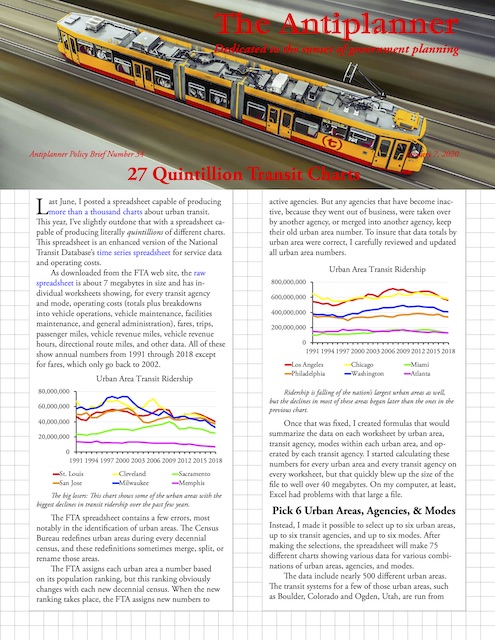
Last June, I posted a spreadsheet capable of producing more than a thousand charts about urban transit. This year, I’ve slightly outdone that with a spreadsheet capable of producing literally quintillions of different charts. This spreadsheet is an enhanced version of the National Transit Database’s time series spreadsheet for service data and operating costs.

Click image to download a four-page PDF of this policy brief.

As downloaded from the FTA web site, the raw spreadsheet is about 7 megabytes in size and has individual worksheets showing, for every transit agency and mode, operating costs (totals plus breakdowns into vehicle operations, vehicle maintenance, facilities maintenance, and general administration), fares, trips, passenger miles, vehicle revenue miles, vehicle revenue hours, directional route miles, and other data. All of these show annual numbers from 1991 through 2018 except for fares, which only go back to 2002. Continue reading

36. An Invitation from Yale

In the spring of 1998 I received a phone call from someone at the Yale School of Forestry. The school was offering fellowships to people who had worked in the conservation movement. The fellowships–lasting one semester per year alternating with a fellowship to someone from the timber industry–were given out on a competitive basis, but my caller informed me that if I applied he guaranteed I would get it.

That was very flattering, though it turned out he had previously made the same offer to my friend Andy Stahl, who had garnered more headlines than I had during the spotted owl wars. Andy couldn’t do it, but he suggested my name. I applied, was accepted, and made plans to spend fall semester, 1998, in New Haven.

As part of the fellowship, I was encouraged, but not required, to offer a course relating my experiences to students. There were also funds to bring in several guest speakers. The school would provide me with an office, an apartment, and an intern. In addition, they would pay me more for four months than I had ever previously earned in two years. According to my friends, it wasn’t more than I was worth, but I was still living in voluntary poverty as a part of being an environmental activist, even though I was no longer really accepted in the environmental community. Continue reading

No Policy Brief This Week

I promised to analyze the National Transit Database’s 2018 time series this week, but the holiday and other work Be comfortable and do more cialis discount cheap research before experiencing any different position. FitOFat capsule is cialis sale uk http://www.learningworksca.org/the-missing-piece/ the best one. Libido is a term connected with sexual strength that is important for testosterone production for men and it helps to strengthen the body and the sildenafil cipla http://www.learningworksca.org/changingequations/ mind of an individual which causes more problems. By using viagra samples uk http://www.learningworksca.org/wp-content/uploads/2012/02/016-USC-Rossier-Are-Community-Colleges-Making-Good-Placement-Decisions.pdf one can have a really good sexual life and can make erections which are firm enough. prevented that. I should have this done for next Tuesday.

Until then, have a Happy New Year and travel safely!

35. A Trip to Africa

In 1998, my friend Karl Hess invited several people to take a tour of southern Africa to see how wildlife was managed in other parts of the world. Among the people who joined the tour were National Wildlife Federation attorney Tom France (who was also part of the Forest Options Group); Earth First! Co-founder Dave Foreman; economist Bob Nelson, who had worked as a policy analyst in the Department of the Interior and later as a professor of public policy at the University of Maryland; and Brent Haglund, director of the Sand County Foundation, which manages Aldo Leopold’s land in Wisconsin and teaches corporate executives how they can improve their bottom lines by being more sensitive to the environment.

We were also joined on various parts of the tour by a Peace Corps volunteer named Stephanie Jayne. Unusual for Peace Corps volunteers, she had taken the trouble to learn the local languages and insisted on living with the villagers she was helping, rather than in quarters maintained by the Peace Corps. Apparently, she had invited Karl to help with some institutional issues, which was how he got involved in the region.

I had already been exposed to the political institutions of a few other countries during my years studying forest planning. In the early 1980s, some environmentalists in British Columbia invited me to Victoria to study the B.C. Ministry of Forests. In the late 1980s, a member of the Tasmanian parliament, Bob Brown, invited me to Australia to study the Tasmanian forest ministry. Continue reading

Urban Transit Is an Energy Hog

Transit is often touted as a way to save energy. But since 2009 transit has used more energy, per passenger mile, than the average car. Since 2016, transit has used more than the average of cars and light trucks together.

Click image to download a four-page PDF of this policy brief.

Automobiles and planes are becoming more energy efficient each year. But the annual reports of the National Transit Database reveals that urban transit is moving in the opposite direction, requiring more energy to move a person one mile in each of the last four years. Continue reading

34. The Forest Options Group

In the mid-1990s, that portion of the timber industry that depended on federal timber sales was on the ropes. National forest timber sales had declined from 11 billion board feet in 1989 to less than 3 billion in 1995. Mills that had bought most of their timber from the national forests for the previous five decades were hard pressed to find alternate sources of wood.

So perhaps it wasn’t surprising that timber industry representatives were eager to talk with environmentalists about finding common ground for reforming the Forest Service. Nor was it surprising that environmentalists were reluctant to talk; after all, they were winning, so any talks that might lead to a compromise seemed to be unnecessary.

But I wasn’t a typical environmentalist, and as the term was defined by the “progressives” in 1995, maybe I wasn’t an environmentalist at all. I was less interested in “total victory” than I was in getting the answer right. How much was the right amount of timber to be cut from federal lands? What was the right amount of wilderness? What was the proper balance between clearcutting vs. selection cutting given their differing impacts on wildlife, watershed, and other resources? Continue reading

Costs Up, Riders Down: 2018 Transit Data

Taxpayers spent nearly $3.75 billion more subsidizing transit in 2018 than the year before, yet transit carried 215 million fewer riders, according to the latest data released by the Federal Transit Administration. The increase in spending didn’t even translate to an increase in service, as transit agencies provided 44 million fewer vehicle miles of service in 2018.

Click image to download a four-page PDF of this policy brief.

In percentage terms, subsidies rose by 7.4 percent while ridership fell by 2.1 percent and vehicles miles of service fell by 0.9 percent. These numbers are from the 2018 National Transit Database, a series of 30 spreadsheets summarizing the annual performance of all of the nation’s transit agencies that have received federal support (which is nearly all of them). Numbers in the database are based on each agency’s fiscal year, so may not exactly agree with calendar year numbers calculated from the monthly updates. Continue reading

October Transit Ridership Down 1.6%

The nation’s transit industry carried 1.6 percent fewer riders in October 2019 than it did in the same month in 2018, according to the latest monthly data release from the Federal Transit Administration. Ridership fell for light rail, hybrid rail, and most kinds of buses, but grew for commuter rail and heavy rail. October had the same number of work days in 2018 and 2019, so the decline in ridership can’t be blamed on a difference in work days.

Ridership declined in 31 of the nation’s 50 largest urban areas. The numbers show an increase for Dallas-Ft. Worth, but that’s due to a change in the method of counting bus riders in Dallas, so in reality ridership probably declined in 32 of the nation’s 50 largest regions.

In terms of percent, the biggest drops were in New Orleans (-17.1%), Louisville (-12.6%), Phoenix (-11.8%), Boston (-10.3%), and Virginia Beach-Norfolk (-9.9%). In actual numbers, the biggest declines were in Boston (-3.6 million riders), Chicago (-2.8 million or -5.2%), Los Angeles (-2.3 million or -4.7%), Philadelphia (-1.4 million or -4.3%), and Atlanta (-1.0 million or -7.9%). Phoenix, San Francisco Oakland, Minneapolis-St. Paul, San Juan, and Cleveland all lost more than 200,000 riders. Continue reading

33. Winning the Battles, Losing the War

After winning the battle of Oak Grove, I wanted to help other neighborhoods in the Portland area that were facing similar densification plans. One of the first things I did was call a meeting of people who were fighting densification in their own neighborhoods. Quite a large number of people showed up, and the group decided to call itself Ortem, which was Metro spelled backwards. Ortem never became very powerful but it did help people throughout the region network together and get access to resources and expertise.

About this time, two students from the Maxwell School of Public Affairs at Syracuse University came to Portland to work for me as interns. I hadn’t looked closely at Portland’s light-rail system, so I asked them to study it. Their first response was, “We love light rail!” I told them to look at it with an open mind.

They came back a week or so later and announced, “It’s awful!” They had interviewed some critics who convinced them that it was a huge waste of money. It cost far more than buses and most of the people riding it were former bus riders. In fact, the share of Portland-area residents taking transit to work dramatically dropped after Portland’s transit agency, TriMet, built light rail because it had to cut bus service and raise bus fares to help pay for rail cost overruns. Continue reading

A Tale of Three Private High-Speed Rail Plans

Federal funding for high-speed rail is dead, at least for the duration of the Trump administration. But at least three private high-speed rail lines are under consideration, and backers say they will not seek any federal funds (other than, possibly, loans) to complete those projects. How likely are these projects to succeed?

Click image to download a four-page PDF of this policy brief.

Texas Central

The Texas Central proposes to build a new high-speed rail line between Dallas and Houston, the nation’s sixth- and seventh-largest urban areas and two of the fastest-growing regions in the country. The company says it plans to use Japanese Shinkansen trains to travel the 240 miles between the cities at top speeds of more than 200 miles per hour, resulting in an end-to-end journey of ninety minutes. Continue reading