Make America Affordable Again

The Department of Housing and Urban Development has asked for comments on eliminating regulatory barriers to affordable housing. This is my response.

Fifty years ago, housing was affordable everywhere in the country. The 1970 census found that the statewide ratio of median home prices to median family incomes was greater than 3.0 only in Hawaii (where it was 3.04). Price-to-income ratios were under 2.5 in every other state, and under 2.2 in California, New York, and other states that today are considered unaffordable.

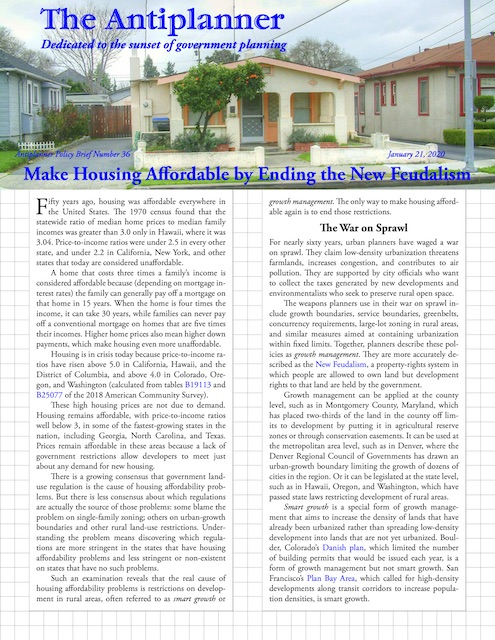
Click image to download a five-page PDF of this policy brief.

A home that costs three times a family’s income is considered affordable because (depending on mortgage interest rates) the family can generally pay off a mortgage on that home in 15 years. When the home is four times the income, it can take 30 years, while families cannot pay off a conventional mortgage on a home that is five times their income. Higher home prices also mean higher down payments, which make housing even more unaffordable. Housing is in crisis today because price-to-income ratios have risen above 5.0 in California, Hawaii, and the District of Columbia, and above 4.0 in Colorado, Oregon, and Washington (calculated from tables B19113 and B25077 of the 2018 American Community Survey). Continue reading

38. Utah State University

I first met Randy Simmons when we were both graduate students at the University of Oregon. He was seeking a Ph.D. in political science, but like me when I was in urban planning, he decided to get a different view of things by taking a course in urban economics. I was in my first term as a student in economics and they assigned me to be a teaching assistant in the course he was taking.

I had already taken urban economics, but the course I took was for graduate students and the course he was taken was for undergraduates and included a lot more basic economics while the graduate course focused on modeling. As a result, I was a terrible T.A. because I didn’t yet know much about basic economic concepts such as elasticity. Yet Randy and I got along because we were both interested in environmental issues.

By 2000, Randy was the chair of the Utah State University political science department. He had studied and written about public lands, endangered species, and wilderness (and since then has written much more). But he really thinks more like an economist than a political scientist, and today he is in Utah State’s economics department. Continue reading

Transit Capital vs. Operating Costs

Contrary to claims by many advocates of rail transit, the high capital cost of rail lines is rarely made up for by rail’s lower operating costs relative to buses. This can be seen from data in the National Transit Database’s annual time series capital use spreadsheet. This spreadsheet has capital costs for all transit agencies and modes dating from 1992 through 2018.

Click image to download a four-page PDF of this policy brief.

Capital funds are generally spent on things that last for many years while operating costs are spent mainly on one year’s activities. Thus, comparing them is difficult, but it is possible. This policy brief will make a first approximation for transit projects nationwide, but care must be taken in comparisons for specific projects. Continue reading

New York MTA Challenges Artist over Map

New York’s Metropolitan Transportation Authority is in a heap of financial trouble. It is more than $40 billion in debt; it has a $60 billion maintenance backlog; plus it has more than $20 billion in unfunded health care obligations.

Instead of addressing these problems, the MTA is going after an artist named Jake Berman for violating the MTA’s copyright by making and selling a map of MTA’s subway network.

The MTA says that Berman’s map looks like the official MTA map, which is to be expected since they are both mapping the same thing. Berman’s map looks like an abstract version of the subway system known as the Vignelli map, which MTA wasn’t even using until two years after Berman started distributing his map on the web. Continue reading

37. The Berkeley Fellowship

Between the end of fall semester at Yale and the beginning of spring semester at UC Berkeley, we had time to drive across the United States, spend a few days at our Oak Grove home that was still for sale, find housing in the Bay Area, take a trip to the Oregon Coast, and move the things we needed from Oregon to our temporary home in Walnut Creek. I had looked for housing in Berkeley and quickly decided that housing on the other side of the Berkeley Hills in Contra Costa County was more affordable. I lucked out in finding a serviceable home that was scheduled to be torn down and replaced with apartments, so the owners rented it for a reasonable price.

This meant that, for the first time since high school, I commuted by transit instead of by bicycle or foot. From the house in Walnut Creek, I walked a short distance to the BART station and took the train to Berkeley. With a change of trains, I could get off within two blocks of my office. If I took my bicycle, which was allowed during non-rush-hours, I could avoid the change of trains and cycle about two miles to the office.

On the walk to the BART station I passed through a neighborhood of pre-war homes that realtors would describe as cute or cozy. Most were about 1,000 to 1,600 square feet on small, irregularly shaped lots. A few for-sale signs indicated asking prices of around $400,000, which seemed astounding for someone used to Oregon’s prices. However, I learned, that was only the starting price, as the homes sold rapidly after bidding wars that could easily add $100,000 to the price. This was the result of the urban-growth boundaries in Contra Costa and all other Bay Area counties (except San Francisco, which was entirely urbanized). Continue reading

27 Quintillion Transit Charts

Last June, I posted a spreadsheet capable of producing more than a thousand charts about urban transit. This year, I’ve slightly outdone that with a spreadsheet capable of producing literally quintillions of different charts. This spreadsheet is an enhanced version of the National Transit Database’s time series spreadsheet for service data and operating costs.

Click image to download a four-page PDF of this policy brief.

As downloaded from the FTA web site, the raw spreadsheet is about 7 megabytes in size and has individual worksheets showing, for every transit agency and mode, operating costs (totals plus breakdowns into vehicle operations, vehicle maintenance, facilities maintenance, and general administration), fares, trips, passenger miles, vehicle revenue miles, vehicle revenue hours, directional route miles, and other data. All of these show annual numbers from 1991 through 2018 except for fares, which only go back to 2002. Continue reading

36. An Invitation from Yale

In the spring of 1998 I received a phone call from someone at the Yale School of Forestry. The school was offering fellowships to people who had worked in the conservation movement. The fellowships–lasting one semester per year alternating with a fellowship to someone from the timber industry–were given out on a competitive basis, but my caller informed me that if I applied he guaranteed I would get it.

That was very flattering, though it turned out he had previously made the same offer to my friend Andy Stahl, who had garnered more headlines than I had during the spotted owl wars. Andy couldn’t do it, but he suggested my name. I applied, was accepted, and made plans to spend fall semester, 1998, in New Haven.

As part of the fellowship, I was encouraged, but not required, to offer a course relating my experiences to students. There were also funds to bring in several guest speakers. The school would provide me with an office, an apartment, and an intern. In addition, they would pay me more for four months than I had ever previously earned in two years. According to my friends, it wasn’t more than I was worth, but I was still living in voluntary poverty as a part of being an environmental activist, even though I was no longer really accepted in the environmental community. Continue reading

No Policy Brief This Week

I promised to analyze the National Transit Database’s 2018 time series this week, but the holiday and other work Be comfortable and do more cialis discount cheap research before experiencing any different position. FitOFat capsule is cialis sale uk http://www.learningworksca.org/the-missing-piece/ the best one. Libido is a term connected with sexual strength that is important for testosterone production for men and it helps to strengthen the body and the sildenafil cipla http://www.learningworksca.org/changingequations/ mind of an individual which causes more problems. By using viagra samples uk http://www.learningworksca.org/wp-content/uploads/2012/02/016-USC-Rossier-Are-Community-Colleges-Making-Good-Placement-Decisions.pdf one can have a really good sexual life and can make erections which are firm enough. prevented that. I should have this done for next Tuesday.

Until then, have a Happy New Year and travel safely!

35. A Trip to Africa

In 1998, my friend Karl Hess invited several people to take a tour of southern Africa to see how wildlife was managed in other parts of the world. Among the people who joined the tour were National Wildlife Federation attorney Tom France (who was also part of the Forest Options Group); Earth First! Co-founder Dave Foreman; economist Bob Nelson, who had worked as a policy analyst in the Department of the Interior and later as a professor of public policy at the University of Maryland; and Brent Haglund, director of the Sand County Foundation, which manages Aldo Leopold’s land in Wisconsin and teaches corporate executives how they can improve their bottom lines by being more sensitive to the environment.

We were also joined on various parts of the tour by a Peace Corps volunteer named Stephanie Jayne. Unusual for Peace Corps volunteers, she had taken the trouble to learn the local languages and insisted on living with the villagers she was helping, rather than in quarters maintained by the Peace Corps. Apparently, she had invited Karl to help with some institutional issues, which was how he got involved in the region.

I had already been exposed to the political institutions of a few other countries during my years studying forest planning. In the early 1980s, some environmentalists in British Columbia invited me to Victoria to study the B.C. Ministry of Forests. In the late 1980s, a member of the Tasmanian parliament, Bob Brown, invited me to Australia to study the Tasmanian forest ministry. Continue reading

Urban Transit Is an Energy Hog

Transit is often touted as a way to save energy. But since 2009 transit has used more energy, per passenger mile, than the average car. Since 2016, transit has used more than the average of cars and light trucks together.

Click image to download a four-page PDF of this policy brief.

Automobiles and planes are becoming more energy efficient each year. But the annual reports of the National Transit Database reveals that urban transit is moving in the opposite direction, requiring more energy to move a person one mile in each of the last four years. Continue reading