In September, 2021, California Governor Gavin Newsom signed a bill abolishing single-family zoning. This bill was a victory for the Yes in Other People’s Back Yards (YIOPBY) movement, as well as for urban planners who sought to densify California urban areas, which are already the densest in the nation.
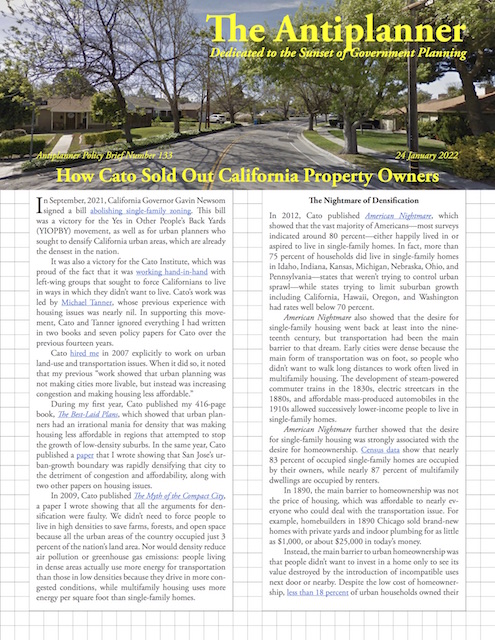 Click image to download a five-page PDF of this policy brief.
It was also a victory for the Cato Institute, which was proud of the fact that it was working hand-in-hand with left-wing groups that sought to force Californians to live in ways in which they didn’t want to live. Cato’s work was led by Michael Tanner, whose previous experience with housing issues was nearly nil. In supporting this movement, Cato and Tanner ignored everything I had written in two books and seven policy papers for Cato over the previous fourteen years. Continue reading