Amtrak Up 1.1% in October

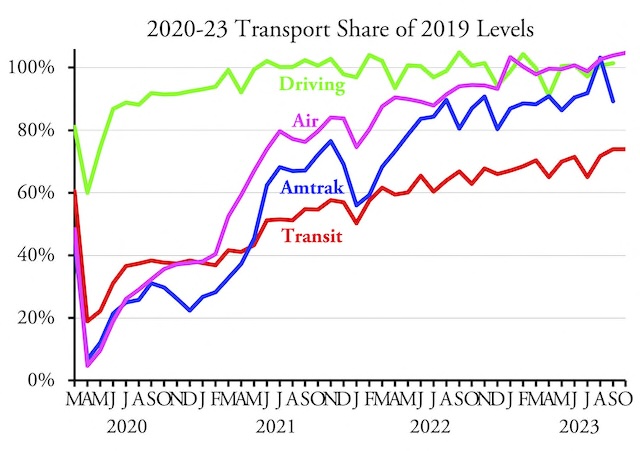
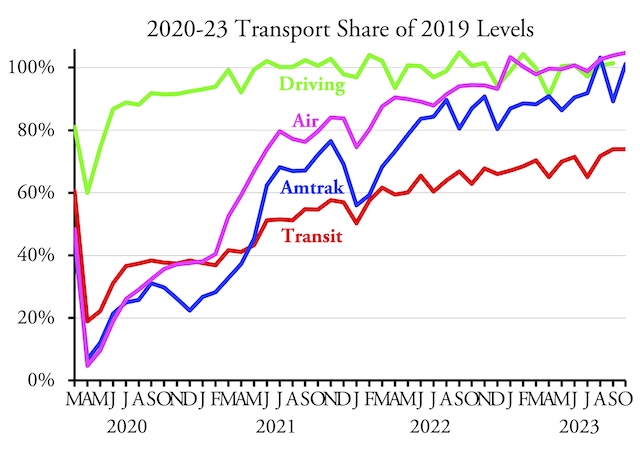
Amtrak carried 101.1 percent as many passenger-miles in October 2023 as in the same month of 2019, according to Amtrak’s monthly performance report. This is the second time in three months that Amtrak carried more than 100 percent of pre-COVID numbers. I’m not sure why it fell to less than 90 percent in September, but August and October numbers suggest that the state-owned company has mostly recovered from the pandemic.

See last week’s post for a review of transit and air travel. October highway data are not yet available but will be posted here when it comes out.

Amtrak divides its trains into the Northeast Corridor, long-distance trains, and state-supported trains mostly operate within a state or between two states. Of these, the Boston-Washington trains are doing best, carrying 11.3 percent more riders than in 2019, and long-distance trains are next at 4.2 percent. However, the state-supported trains carried just 92.5 percent as many riders as in 2019. Continue reading

More California High-Speed Spending

Remember DesertXpress, later known as Xpress West? It was going to be a high-speed train between the Los Angeles area and Las Vegas. Projected to cost under $5 billion, the company said it would build and operate it without any subsidies. The Antiplanner was skeptical.

Brightline’s image of its high-speed train across the desert.

The project is now owned by Brightline, the company that runs the moderate-speed trains in Florida that are unsubsidized if you don’t count all the people they are killing and the government-funded safety improvements aimed at reducing those deaths. Projected costs of the Vegas line have risen to $12 billion, partly because Brightline sensibly decided that it would have to build into Los Angeles to get any riders. Far from not needing any subsidies, Brightline was overjoyed to receive a $3 billion grant from the federal government. One news report calls this a bet, but it’t not really betting if you are using other people’s money. Continue reading

October Transit Ridership Levels Off

Transit carried 73.90 percent as many riders in October 2023 as in the same month in 2019, according to data released by the Federal Transit Administration yesterday. This is just a couple of hairs less than the 73.92 percent carried in September. Rail ridership was 71.0 percent of 2019 while bus ridership was 76.6 percent. Actual October ridership was more than September’s, which is the case for most years.

As with last month, New York, Los Angeles, Miami, and Houston transit systems are much better than average, carrying 78 to 85 percent of 2019 levels. Washington seems to have caught up with the average, carrying 73.7 percent. Atlanta, Boston, Phoenix, and San Francisco are all doing worse than average, carrying less than 70 percent and, in Phoenix’s case, less than 56 percent of 2019 numbers. Continue reading

More on High Rises and Fertility Rates

The Antiplanner was first alerted to a tweet about South Korea’s low birth rate from Marginal Revolution, a blog from George Mason economists Tyler Cowen and Alex Tabarrok. Being from George Mason, they lean libertarian, but haven’t learned enough about housing economics to realize that YIMBYism isn’t about housing affordability or property rights but about forcing more Americans to live in multi-family housing.

The ideal American city under YIMBYism. Photo of Seoul by Gerhard Huber.

So I appreciated it when Cowen mentioned my post on birth rates and high-rise housing in Marginal Revolution. They get a lot more readers than this blog, so it led to lots of comments. Continue reading

Building Rail It Can’t Afford to Operate

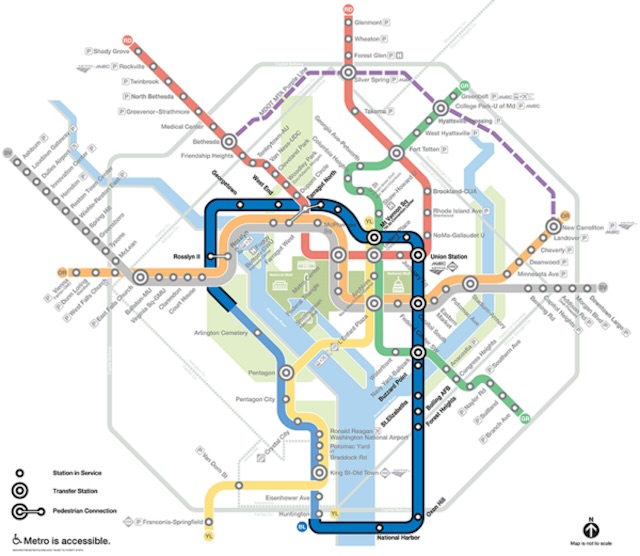
Washington Metro is facing a $750 million shortfall in its 2025 budget and may have to cut service as soon as next spring. Meanwhile, its board of directors will be asked to approve an expansion of its Blue Line that will cost at least $30 billion and probably much more.

As the Antiplanner noted last July, the new line is supposedly needed because the existing Blue, Orange, and Silver lines all use the same tunnel under the Potomac River and the line can only handle 26 trains per hour. The Blue Line trains were running at capacity when the Silver Line opened, so Metro lost more Blue Line riders than it gained Silver Line riders when Blue Line trains were cut to make room for Silver Line trains. Continue reading

How to Kill a Country

Much of Seoul is a sea of high-rises. And not just Seoul: Busan and other cities in South Korea have lots of high rises. More than half of all South Korean households live in high rises, and well over 60 percent live in some kind of multifamily housing.

Seoul: High rises as far as the eye can see. Photo by Francesco Anzola.

South Korea also has the lowest birthrate of any country in the world. The latest numbers say the average woman has just 0.70 children in her lifetime. Birthrates need to be 2.1 per woman for a population to remain constant; at 0.70, South Korea will be almost totally depopulated in just three generations. Seoul’s birthrate is 0.64 and, due to an aging population, it will likely fall to 0.30 in the next ten years. Continue reading

Spending More to Get Less

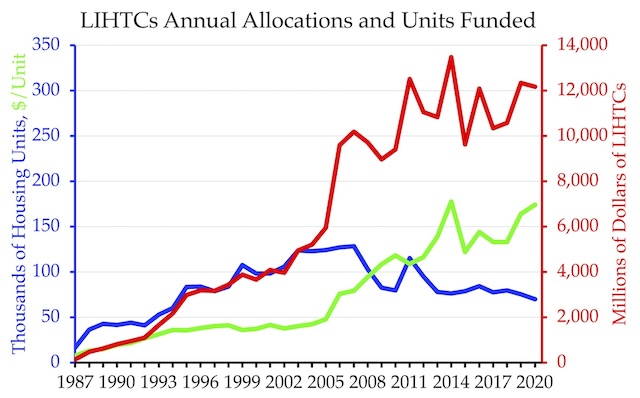
Taxpayers are spending more to subsidize low-income housing and yet getting less. Since 1987, the biggest source of funds for affordable housing has been low-income housing tax credits, which offer billions of dollars in reduced taxes if they dedicate some of the housing they build to households earning less than 60 percent of the median incomes in their regions. These tax credits are given to state housing agencies based on each state’s population and the housing agencies grant them to developers through a competitive application process.

Source: LIHTC Database, Department of Housing and Urban Development, https://lihtc.huduser.gov.

As the above chart shows, the numbers of housing units built with such funds roughly kept pace with the annual subsidies until 2004. Then subsidies dramatically increased while the number of housing units built declined. Between the 2000s and 2010s, the average inflation-adjusted subsidy per housing unit grew by 125 percent. Since 1987, 30 states have created their own affordable housing tax credit programs as well as other housing subsidies, so when they are all added together it is likely that the subsidies per housing unit have grown even faster than shown in the chart. Continue reading

Just Say No

The city council of the town of Grimes, Iowa — a suburb of Des Moines — had voted to end support for the Des Moines Area Regional Transit Authority (DART). City council members noted that it is spending $646,000 a year to support the transit system and yet only 13 residents of Grimes rode transit in the last year. “When you look at the math,” commented Grimes Mayor Scott Mickelson, “you could buy everybody a couple of cars for that price.”

Des Moines has an impressive downtown, but not many people there use its transit system. Photo by Jason Mrachina.

Naturally, the transit agency was unhappy with this decision. “When you think about people who are our frontline workers, a lot of them are using DART to get to their jobs,” said DART’s CEO, Amanda Wanke. “A lot of them don’t have another option for a vehicle. During these economic times, public transit is more necessary than ever.” Continue reading

Throwing Good Money After Bad

The Federal Transit Administration has agreed to give Honolulu another $125 million to finish its insane rail transit line. Years ago, the FTA agreed to provide $1.55 billion for the rail line, but that was when the line was expected to cost $5.1 billion.

When projected costs exploded to $12 billion and the city proved to be an inept project manager, the FTA withheld about half of the promised money, saying that it didn’t believe the city would be able to complete the project. Now, after redesigning the system, negotiating with the FTA, and no doubt twisting some arms, the federal agency is handing over about 17 percent of the withheld funds. Continue reading

2022 Household Transportation Data Released

The average motor vehicle on the road carried 1.52 people in 2022, down from 1.67 in 2019, according to the 2022 National Household Travel Survey. The results of this survey, which is repeated about every five years, were recently released by the Federal Highway Administration.

The survey has lots of interesting data, including information on motor vehicles, vehicle trips, and passenger-miles of travel. Much of it, however, is not quite ready for prime time. For example, the data release indicates that households who earn less than $10,000 a year nevertheless own 6.3 million vehicles — but it doesn’t say how many households that represents or how many don’t own vehicles. Continue reading