
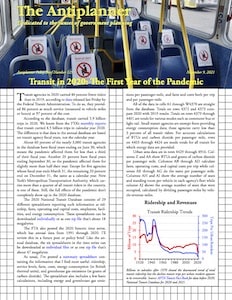
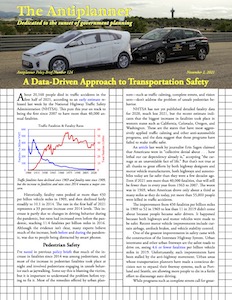
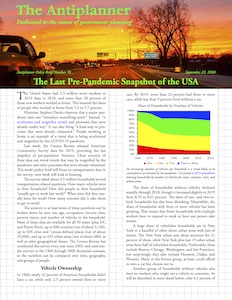
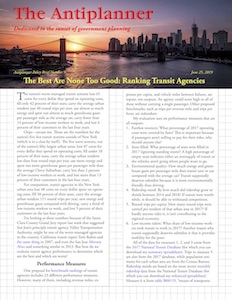
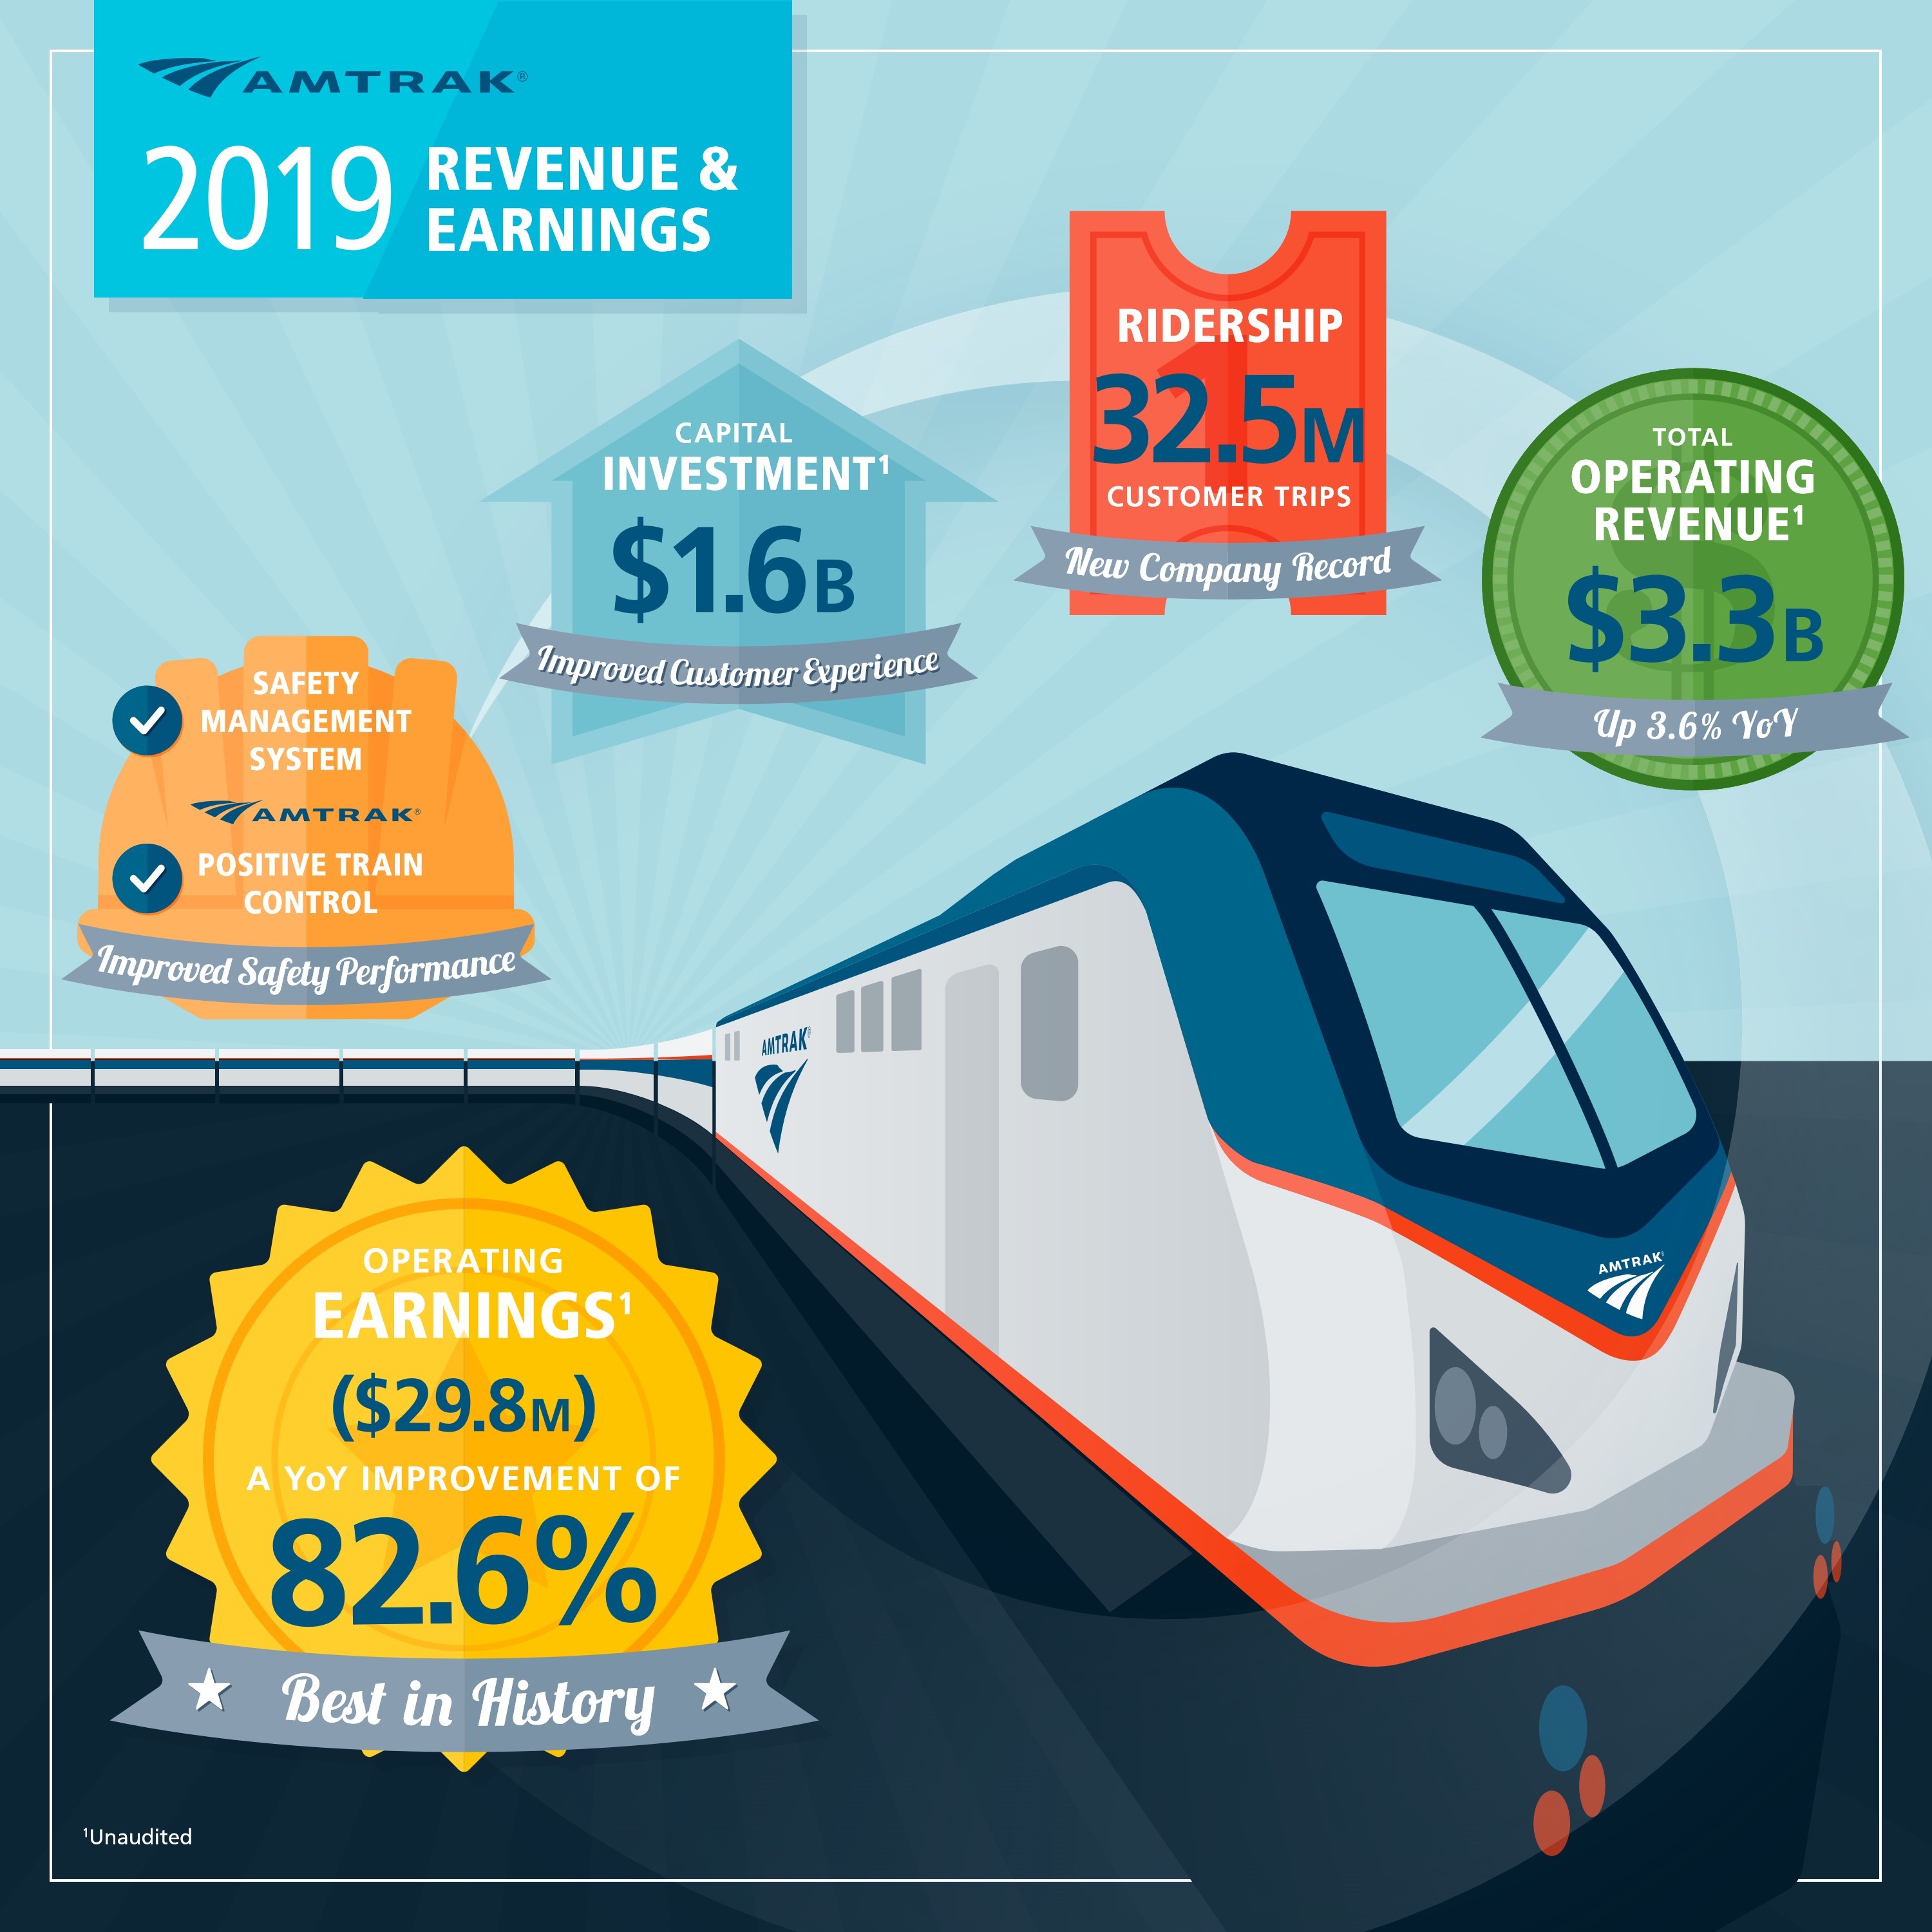
If Amtrak were a public corporation rather than a government-owned entity, a recent press release and other public statements by Amtrak officials would be considered securities fraud. According to the press release issued last week, fiscal year 2019 was Amtrak’s best year ever. The release claimed that operating revenues covered 99.1 percent of its operating costs, and Amtrak officials are so optimistic about the future that they predict the company will actually earn a profit next year.
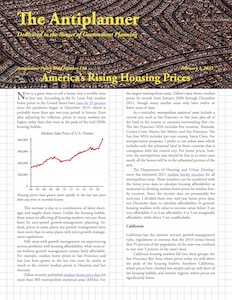
 Click image to download a three-page PDF of this policy brief.
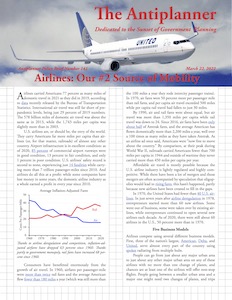
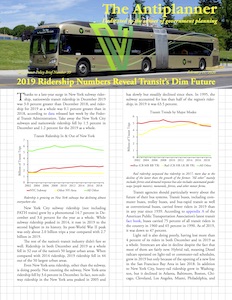
Amtrak made these statements before it released its annual financial report (which is still not available), substituting instead an infographic. Moreover, the press release deliberately misrepresented the information that will eventually be published in that financial statement. Amtrak is counting on the fact that far fewer people will read the financial statement than the press release or news reports about that release. Continue reading


